Introduction
As I was writing my blog posts about the SOLID principles, I was contacted by Patrick Smacchia the lead dev of the .NET tool NDepend. Patrick offered me a license, if I was willing to write my experience of using the tool in my blog.
I had my eye on this tool, as I was interested in its ability to create graphs with the dependencies between the classes in a project, so I accepted his proposal provided I could write my honest opinion. After spending some time using NDepend, I realized that it can do much more than creating graphs with dependencies between classes.
In this post I will try to write about its features. Be assured that this is my honest and unbiased review. This post is not dictated, and I am not affiliated in any way with NDepend. Any links to NDepend are not affiliate links and I provide them for convenience.
An Overview of NDepend
NDepend is a static analyzer and code quality tool for .NET developers. It gives you over a hundred metrics about your code quality and can create graphs with dependencies, not only between classes, but also between assemblies, namespaces and even between the methods and the fields inside your classes.
It is a paid product, but offers a 14-day evaluation period, for anyone who wants to try it. Although I believe it can be expensive for a single developer or a hobbyist, depending on where in the world you live, I believe it can be invaluable for a professional or a company.
It comes as a standalone program but also has a Visual Studio plugin, so the same functionality can be used inside the Visual Studio editor. In this review, I used mostly the standalone program, although I also tried the Visual Studio integration that integrates perfectly and offers the same functionality. Besides those two ways, it can be used in the command line and also offers versions for Windows, Linux and Mac build servers for Continuous Integration, a version for Azure DevOps and a version that integrates with GitHub actions.
Any reports produced by NDepend, can be exported to HTML, so that they can be viewed easily and shared among the developers of the project. These reports can be customized to contain the metrics that are considered more important for each project, but the most important thing, is that each metric can also be customized.
Customization of The Inspection Engine
What is impressive about NDepend is that its metrics are completely customizable and that you can create your own metrics by using its CQLinq syntax. If you are familiar with the C# LINQ, then CQLinq allows you to completely customize your metrics, change the thresholds of all the metrics already included (which are over a hundred) and it does that, without the need to wait for any kind of recompilation. CQLinq is a big part of the customization of NDepend, so I won’t go into the details here, but it is very powerful and can change completely the reports of the static analysis so that it can reflect the needs of each project.
Here is an example that already exists as a metric in NDepend that checks for non-readonly static fields, so that you can get an idea about CQLinq:
warnif count > 0
from f in JustMyCode.Fields
where f.IsStatic &&
     !f.IsEnumValue &&
     !f.IsGeneratedByCompiler &&
     !f.IsLiteral &&
     !f.IsInitOnly

let methodAssigningField = f.MethodsAssigningMe

select new {
   f,
   methodAssigningField,
   Debt = (2+8*methodAssigningField.Count()).ToMinutes().ToDebt(),
   Severity = Severity.High
}
Comparisons of Results Between Builds
Metrics and potential problems about your code, are not absolute. A nice feature of NDepend, is that you can define a baseline for your project. Any changes to that baseline, give an indication of where your project is headed.
Seeing new potential problems, can warn you about the feature consequences those problems may cause. As I described in my SOLID posts, architecture is about time investment. The important thing is not to solve every possible problem that your code may have, but to have knowledge of these problems so that you can make a conscious decision if they should be fixed or not.
NDepend is like having a second pair of eyes, looking at your code in a more high-level way. Many things you might miss, will be revealed, not only in the metrics but also in the graphs of dependencies. Running NDepend in some of my projects, revealed some dependencies and problems that I hadn’t noticed, but before that, let’s start from the beginning: The installation, the metrics and the dependencies graphs.
Installation
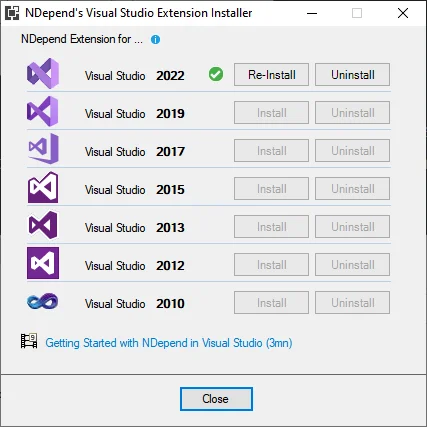
NDepend comes as a zip file. You unzip the file, if you have a license key you type it, and you are ready to go. The zip file, does not contain an installer, it just has the NDepend executables. These executables are the standalone NDepend program, the Visual Studio plugin installer and the NDepend console program. I prefer this way: just unzip, and it is ready to use, but YMMV.
Metrics
Let’s continue with the important things NDepend has to offer: the reports, the metrics and the graphs of dependencies.
The Html report contains a customizable subset of the metrics and the graphs you get from the main Ndepend program:
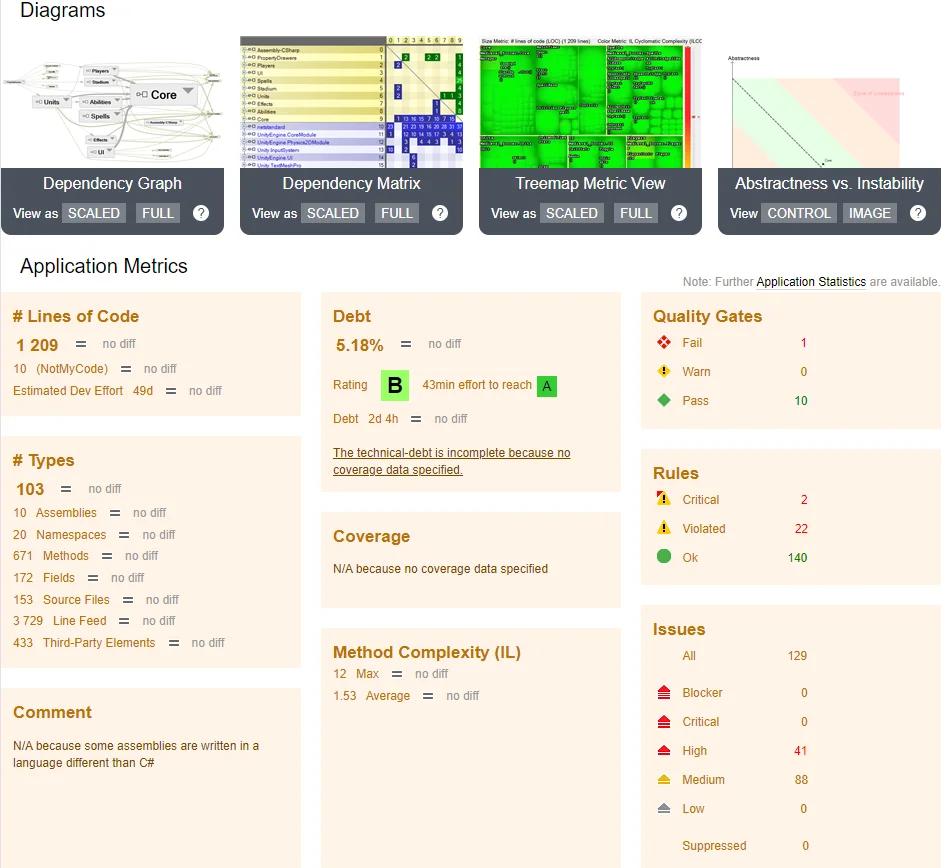
The four diagrams are clickable, so that can be viewed in isolation, and of course are customizable, as are the metrics from the main NDepend program to contain the relevant diagrams and metrics for you project.
In the main NDepend program, the dashboard that contains the metrics looks like this:
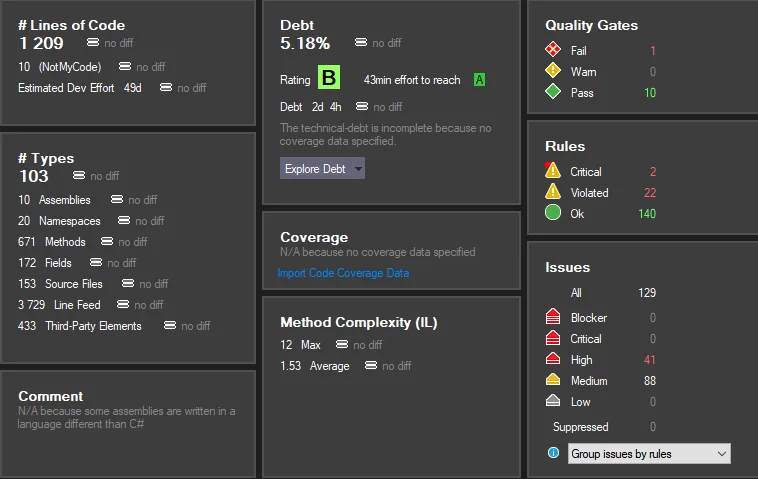
Here everything is clickable, to get a more detailed description of each metric and the rules that affect it. As you can see there are metrics for Rules broken, issues in the project, technical debt and others, with each one having levels of severity. Everything can be customized: How the metrics are calculated, the severity of each issue, which issues add to each metric and someone can even create new issues that affect the metrics via the use of CQLinq.
What I liked in NDepend, is that by clicking the relevant metric, there is a description for every issue that describes what it represents, a link to a more detailed explanation on the site, but also a detailed view that shows where in your code those issues exist. For example, if I click on the Debt metric, I can see the relevant rules that add to that metric:

and by clicking on the issues, where exactly those issues exist in my codebase:
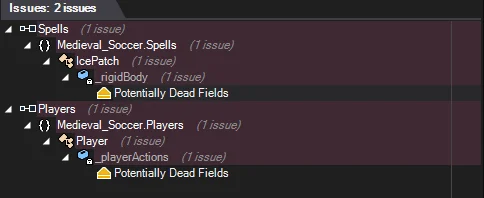
As I said before, all those rules for the metrics are customizable, they can be ignored, you can change the thresholds, or even create you own.
There are over a hundred rules that contribute to the metrics and issues detected by NDepend, from simple ones like the lines of code or avoiding big classes in you project to more complicated ones, like finding potentially dead fields or avoiding types initialization cycles.
There are also rules, for the Unity game engine scripting, as NDepend can analyze Unity projects, although here, I found a false positive about creating a new instance of a scriptable object when in fact the new instance was of a POCO class. This is not a big problem though, as it can be customized with the use of CQLinq or can be completely ignored.
Many of the metrics can be visualized. Here is an example from one of my projects:
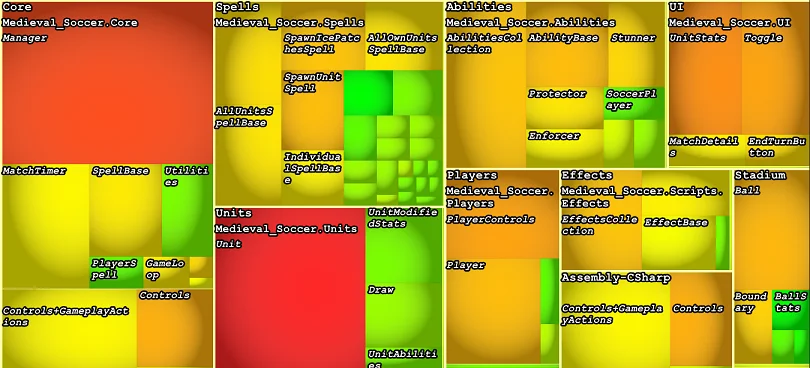
I have made in this visualization, the size of each orthogonal shape to represent the number of lines of code for each class and the color to represent the number of the types used by each class. As before these can be customized, with the dropdown menus provided, to represent whatever is needed for each project.
Dependency Management
Let’s see, the reason I had my eye on NDepend before, and probably the feature that NDepend takes its name from. The graphs that show the dependencies between assemblies, namespaces, classes and even methods and fields.
Although the metrics NDepend has, exist in some other static analyzers, I don’t know of any program that can have the functionality of NDepend in a higher level architecture.
Here is a dependency graph generated from one of my hobby projects:
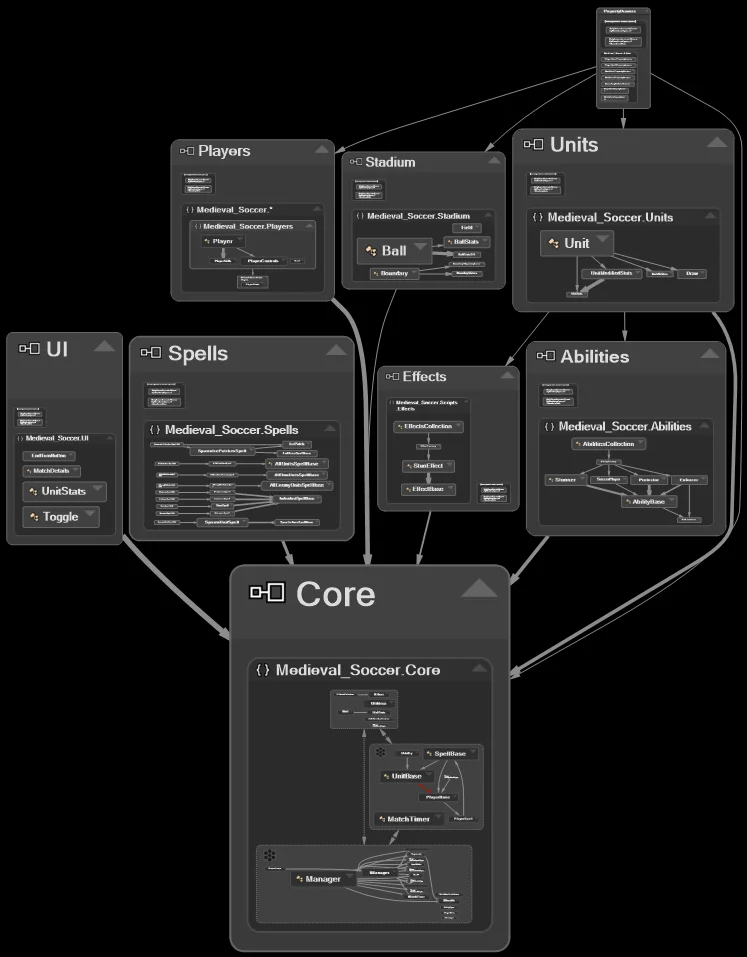
There is an option to generate a top-down or left-right graph. This graph is about the types in the project, but there are options for the other kinds of dependencies or if the user likes, can press the arrows on the right of each orthogonal shape to expand or reduce it. With every expansion, there will be a lower level information.
The thing that is more impressive though, is that by hovering over each element, it gets highlighted and shows its direct and indirect dependencies:
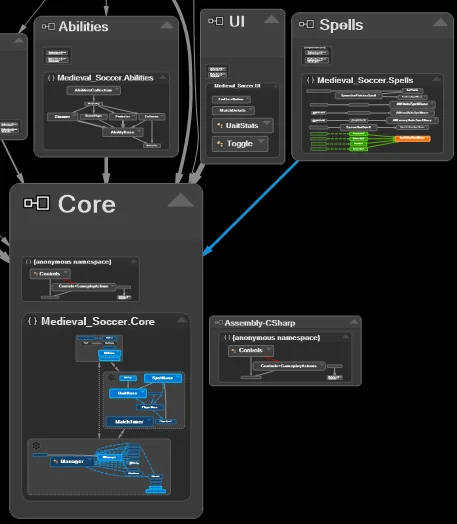
Here by hovering my mouse cursor over a class (the orange) I get to see which classes depend on it (the green ones) and which classes are being used by this class (the blue ones), either directly or indirectly (the dashed arrows indicate indirect connections).
Here is an example of the dependencies between each class’ methods and fields:
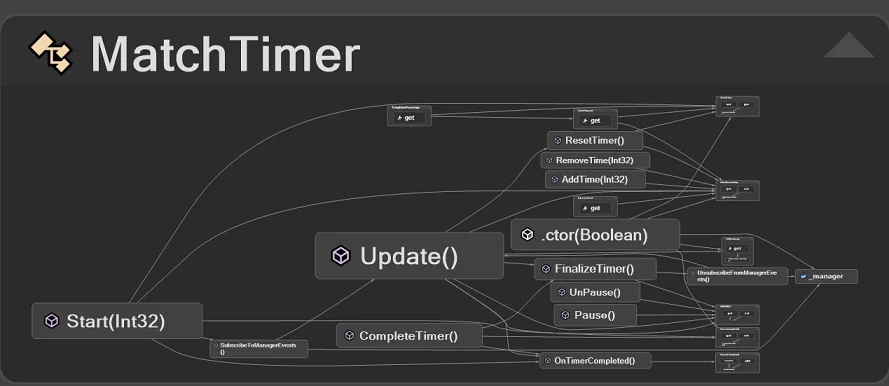
There is even a dependency matrix for a better understanding of the dependencies in big projects:
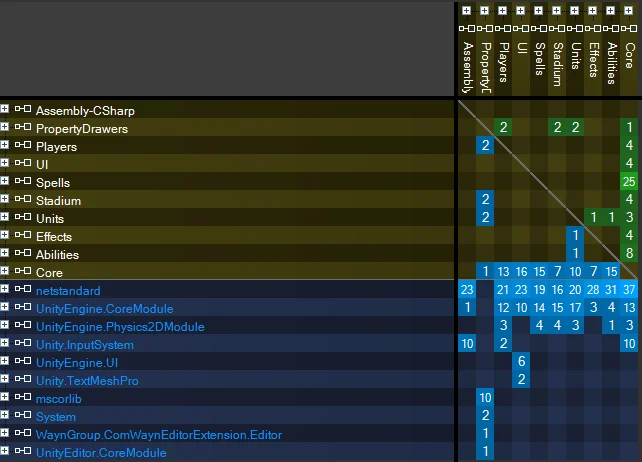
Finally, you may have noticed a red arrow in the first two graphs. This arrow indicates a problem, two classes that each depend on the other. Another impressive feature, is that by double-clicking this arrow, NDepend can suggest an architecture, if possible, that splits those two classes to avoid the double dependency. This can happen because NDepend doesn’t only know the dependencies between our classes, but also which dependencies exist among our methods and fields.
SOLID Architecture
By using the above features of NDepend, we can have a more SOLID architecture. As I mentioned in my SOLID: How to use it, Why and When post,the important thing in SOLID is not the rules themselves, but the problems they solve. By learning to recognize those problems we can make a conscious decision to solve them or not, by trying to understand if they will have consequences for our project in the future.
NDepend, can warn us for any problems that exist in our code, or problems that have been created since our last build, that otherwise we would have missed. Although every time I write a class, I try to maintain a graph of the dependencies by using draw.io, so that I can check my higher level architecture, mistakes can happen. By using NDepend in some of my projects, I have found a few dependencies that I had forgotten to add to my graphs. Automatic is always less error-prone than manual, and this is what NDepend does: It automates some of the work that we have to do manually.
Use cases
As I mentioned at the beginning of the post, NDepend is a paid product. Its price can be too much for an individual, especially in certain areas of the world, but I believe there are some use cases that NDepend is actually worth to buy:
- A professional programmer, that has big projects that last for a big amount of time, can use NDepend to have a high-level view of his codebase and a comparison of the quality of his code, between points in time.
- A company that has many programmers working in a project, can use NDepend, not only for an overview of the project, but also for checking each commit to the project and even automating the denial of some commits that don’t follow certain metrics or create architectural problems.
- A programmer or a team of programmers that have been tasked to refactor legacy code. NDepend can give an overview of the dependencies between the types that exist in the project. This way, they can visualize how each part of the program connects to each other parts.
- A programmer that has been hired as an analyst for a project and is required to give consultation for its architecture. Although this seems the same as the refactoring above, the difference is that this refactoring in architecture will be happening while new commits to the project are being made simultaneously by the programmers of the project. NDepend, can indicate hot spots which have a higher priority, depending on the project, that need to be fixed first as they create bottlenecks and technical debt.
- A project leader that wants a tool, which can offer visual explanations of the problems that exist in a project, or how the amount of problems in a project has changed over time, to people that don’t have any technical knowledge.
Conclusion
This was my review of NDepend, I realize that it is not for everyone, especially new programmers or hobbyists, but can be invaluable to certain cases.
There is a 14-day evaluation period for anyone who wants to try it. Its price, can seem a lot or not, depending on the use case and the amount of time it will save, that will translate as an increase in productivity, especially for long projects with many moving parts.
Thank you for reading, and as always, if you have any questions or comments you can use the comments section or contact me directly via the contact form or by email. Also if you don’t want to miss any of the new blog posts, you can always subscribe to my newsletter or the RSS feed.