Introduction - What Is The Performance Testing Package
Unity provides several tools to evaluate the performance of your game. One such tool is the performance testing package for Unity test framework. As the name suggests, it is an extension to the Unity test framework. Unlike the Unity Profiler, which measures the performance of your entire game, this framework allows you to focus on specific portions of your code in isolation.
This capability can be either advantageous or limiting, depending on how it is applied. On one hand, it’s not particularly useful for analyzing code segments that are neither part of a hot path nor bottlenecks, as they won’t significantly impact your game’s overall performance. On the other hand, it’s invaluable for examining the behavior of critical parts of your code, such as measuring execution time or garbage collection for different implementations of the same functionality.
In this guide, I will provide an overview of the various ways you can use the Performance Testing Package. Additionally, I will demonstrate its usage by measuring the performance of different Unity timer implementations, which I discussed in my previous post, Various Timer Implementations in Unity.
Overview Of The Performance Testing
After installing the Performance Testing Package, you can use the Performance attribute in addition to the Test or UnityTest attributes in a method to measure the performance of specific code segments. There are two primary ways to perform these measurements:
Using Measure.Method()
The Measure.Method static method accepts an Action parameter that contains the code you want to measure. After specifying the code, you can use fluent syntax to configure additional options for your measurement. Once everything is set up, call the Run() method to begin the measurement.
One of the key advantages of Measure.Method is the GC() option, available through fluent syntax, which provides the total number of garbage collection allocations. This makes it the ideal choice for measuring garbage collection calls in edit mode tests, i.e., methods decorated with the Test attribute.
You can also execute setup code before the measurement using the SetUp method in the fluent syntax and perform cleanup afterward using the CleanUp method. Both methods take an Action delegate as a parameter.
Using Measure.Frames()
The Measure.Frames static method is designed for play mode performance tests and is used alongside the UnityTest attribute. It measures frame execution time, and its Run method returns an IEnumerator. This allows it to be used after a yield instruction in a play mode test.
Both Measure.Method and Measure.Frames offer fluent syntax options to control parameters such as:
The desired warmup period or number of executions before starting the measurement.
The number of measurements to take, defined by the number of executions or frames (for
Measure.Frames).A
DynamicMeasurementCountmethod, which continues taking measurements until a specified margin of error is achieved.
If you need to measure only specific parts of your code and have setup or cleanup operations (similar to the Measure.Method option), you can use the Scope() method within a using block, as shown below:
// setup code

using (Measure.Frames().Scope())
{
    // code to test
   // yield return here
}

// cleanup code
Using Measure.Scope()
We can use the Measure.Scope() method to measure a portion of code inside a using block in editor tests.
Using Measure.ProfilerMarkers()
The Measure.ProfilerMarkers() static method is also used within a using block for play mode tests. It is particularly useful for recording profiler markers. Additionally, you can add your own profiler markers for custom recording. For more information, see Adding profiler markers to your code
Using Measure.Custom()
When you need to measure something other than profiler markers or execution time, such as method or frame execution time, you can use the Measure.Custom method. This method accepts a parameter of type double, which represents your custom measurement.
Sample Groups
All the above options support Sample Groups. These allow you to group your performance test results. Each sample group can have a unique name, different measurement units, an option to indicate whether a higher value is better, and variables that provide specific information about the performance tests in that group, such as their average value or standard deviation.
Viewing The Results
After running your tests, you can view the results in the Inspector window. Alternatively, you can open the (Window -> General -> Performance Test Report) window to access a graphical representation (a histogram) along with the test results.
Let’s examine some performance tests by evaluating initialization performance, the total number of garbage collection allocation calls, and the per-frame performance impact of each of the three different Unity timers I implemented in my previous post.
Example: Testing My Timer Implementations
Let’s see first the performance tests for the initialization performance of the three timers:
[TestFixture]
public class TimerInitializationPerformance
{
   private UpdateTimer updateTimer;
   private Timer awaitableTimer;

   private const float DURATION = 5f;
   private readonly SampleGroup sampleGroup = new("TimerEditorInit", SampleUnit.Microsecond);

   [Test, Performance, Order(1)]
   public void InitializationMinimalTimerPerformance()
   {
      Measure.Method(() =>
      {
         MinimalTimer.Start(DURATION);
      }).MeasurementCount(30).GC().SampleGroup(sampleGroup).Run();
   }

   [Test, Performance, Order(2)]
   public void InitializationUpdateTimerPerformance()
   {
      Measure.Method(() =>
      {
         updateTimer.Start(DURATION);
      }).SetUp(() =>
      {
         updateTimer = new UpdateTimer();
      }).CleanUp(() =>
      {
         updateTimer.Stop();
      }).MeasurementCount(30).GC().SampleGroup(sampleGroup).Run();
   }

   [Test, Performance, Order(3)]
   public void InitializationAwaitableTimerPerformance()
   {
      Measure.Method(() =>
      {
         awaitableTimer.Start(DURATION);
      }).SetUp(() =>
      {
         awaitableTimer = new Timer();
      }).CleanUp(() =>
      {
         awaitableTimer.Stop();
      }).MeasurementCount(30).GC().SampleGroup(sampleGroup).Run();
   }
}
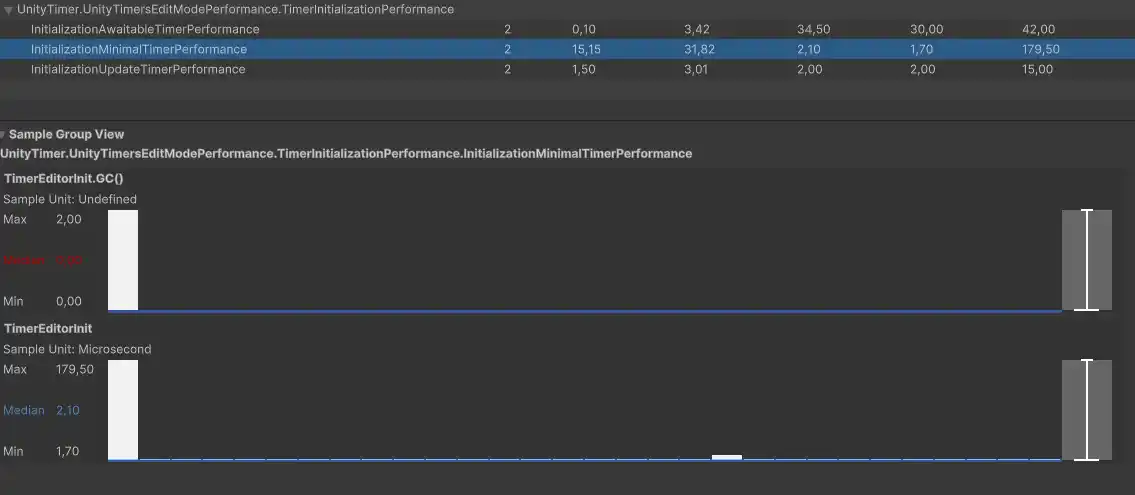
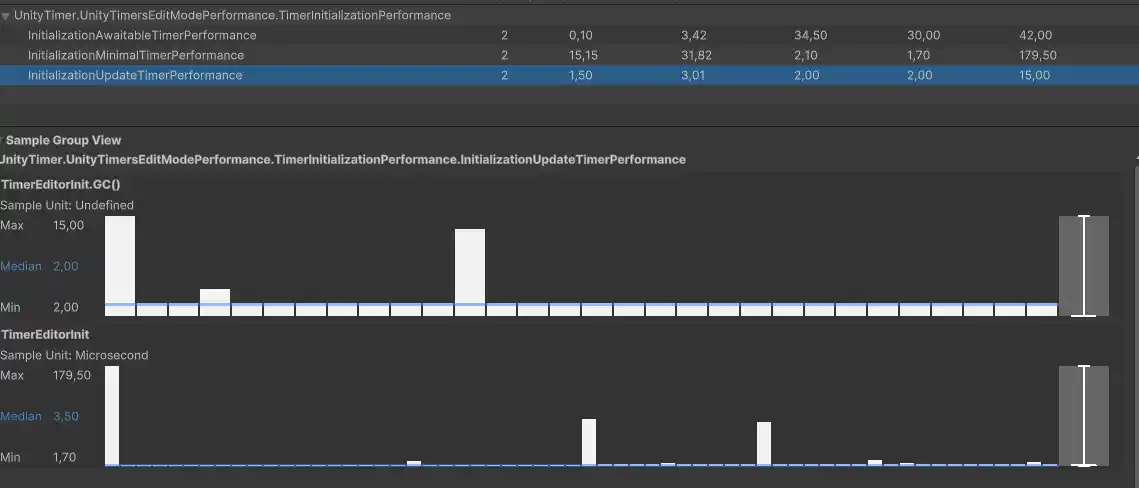
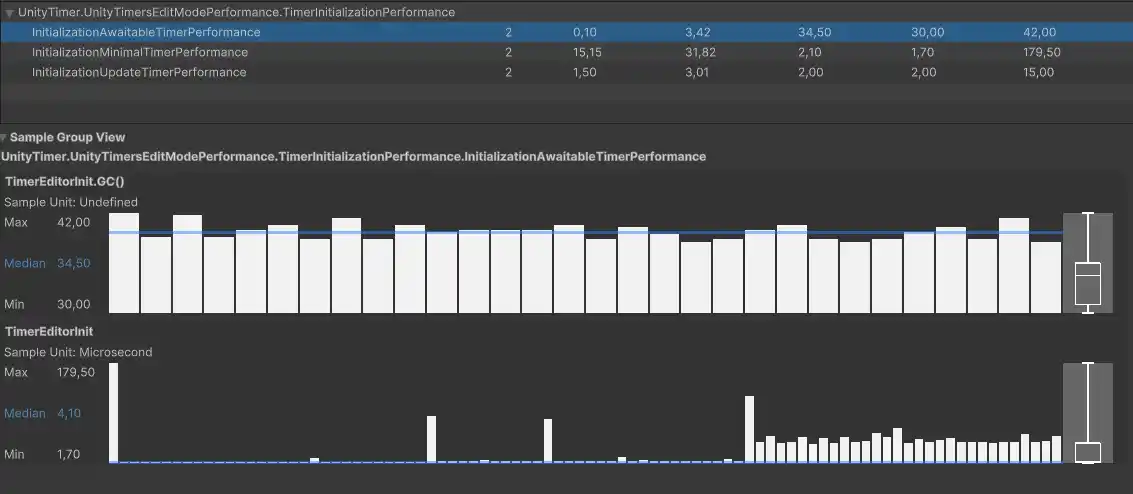
Here, I use the Measure.Method to assess the performance impact of starting a timer. The SetUp method is employed to initialize the timer, as this step should not be included in the measurement since initialization can occur anywhere in the code. Additionally, I use the GC() method to track garbage collection allocation calls.
Naturally, the measurements depend on the target hardware. However, anyone running this test will observe that the execution time differences are minimal, typically within single-digit microseconds.
What stands out are the allocation calls. As expected, the minimal timer, implemented as a struct, results in zero allocations. In contrast, the update timer generates a few allocations, while the timer utilizing the Awaitable incurs substantial allocations.


To test performance in play mode, we can use the Measure.Frames method. For instance, if we want to evaluate the performance cost of the UpdateTimer in play mode—since its Tick() method needs to be called every update—we can create a performance test like this:
    [UnityTest, Performance]
    public IEnumerator UpdateTimerPerformanceWithEnumeratorPasses()
    {
        updateTimer = new UpdateTimer();
        updateTimer.Start(DURATION);

        using (Measure.Frames().DynamicMeasurementCount().Scope())
        {
            while (!updateTimer.IsCompleted)
            {
                updateTimer.Tick();
                yield return null;
            }
        }
    }
Here, each yield return null marks the end of one frame, and we only measure the performance impact of the IsCompleted property getter call and the Tick() method. The execution time for initializing and starting the timer is excluded from our measurements because these operations occur outside the using block.
Conclusion
The profiler is better suited for analyzing the performance of larger segments of a game where multiple pieces of code run concurrently. In contrast, the Performance Testing Package for the Unity Test Runner enables us to compare specific code implementations. If you want to evaluate small code snippets in isolation or measure the performance impact of individual calls to Unity’s API, the Performance Testing Package is the ideal tool. While it provides less information than the profiler, it is also simpler to use. Moreover, it can complement the profiler by utilizing the Measure.ProfilerMarkers method, allowing you to include profiler-based measurements in your tests.
As always, thank you for reading, and if you have any questions or comments you can use the comments section, or contact me directly via the contact form or by email. Also, if you don’t want to miss any of the new blog posts, you can subscribe to my newsletter or the RSS feed.